
Impact of Substitute Goods and Services in the Supply Market.
As explained, Substitute commodities or services are those which are capable of being used in place of each other to satisfy the same need, a good example being tea and coffee in satisfying thirst. In the supply market, the demand of a specific product or service varies directly with the price of its substitute. For instance, when the price of a specific product like coffee increases, the effect will increase in the demand its substitute, say tea, due to the fact that tea will become relatively cheaper than coffee. This is illustrated in figure 6.2.1 below.
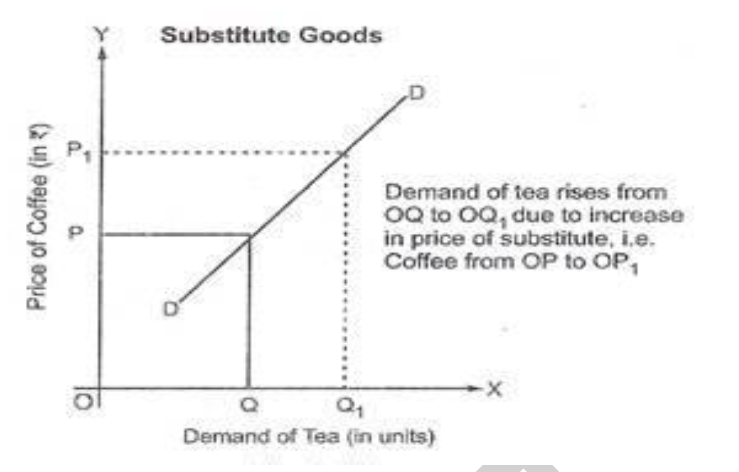
Figure 6.2.1
As indicated in the above diagram, the price of coffee which is a substitute for tea is represented in the Y-axis while that of Tea is presented in the X-axis. When the price of coffee rises from OP to OP1, demand for tea also rises from OQ to OQ1.
Changes in Prices of substitute Goods.
An increase or a decrease in the price of substitutes for a particular product or services impacts directly on the demand for that particular product or service as shown in figure 6.2.2 below

The demand curve of a given commodity (tea) shifts towards right from D to D1 due to increase in the price of the substitute good (coffee) as shown above.
a) Increase in Price of Substitute Goods
If the price of coffee which is a substitute for tea increases, demand for tea will increase from OQ to OQ1 in the diagram given its price remains at OP. It leads to a rightward shift in the demand curve of the given commodity from DD to D1D1. This is illustrated in Figure 6.2.3 below

Figure 6.2.3
b) The decrease in Price of Substitute Goods:
In the same example, when the price of coffee, a substitute for tea, decreases, the effect will decrease in the demand for tea from OQ to OQ1 considering the price remains at OP. The demand curve of tea will shift to the left (D1D1) as illustrated in figure 6.2.4 below.
